


Today's Sector Analysis: Nifty IT and Construction Gain While Oil and Gas Lags

January 23, 2025
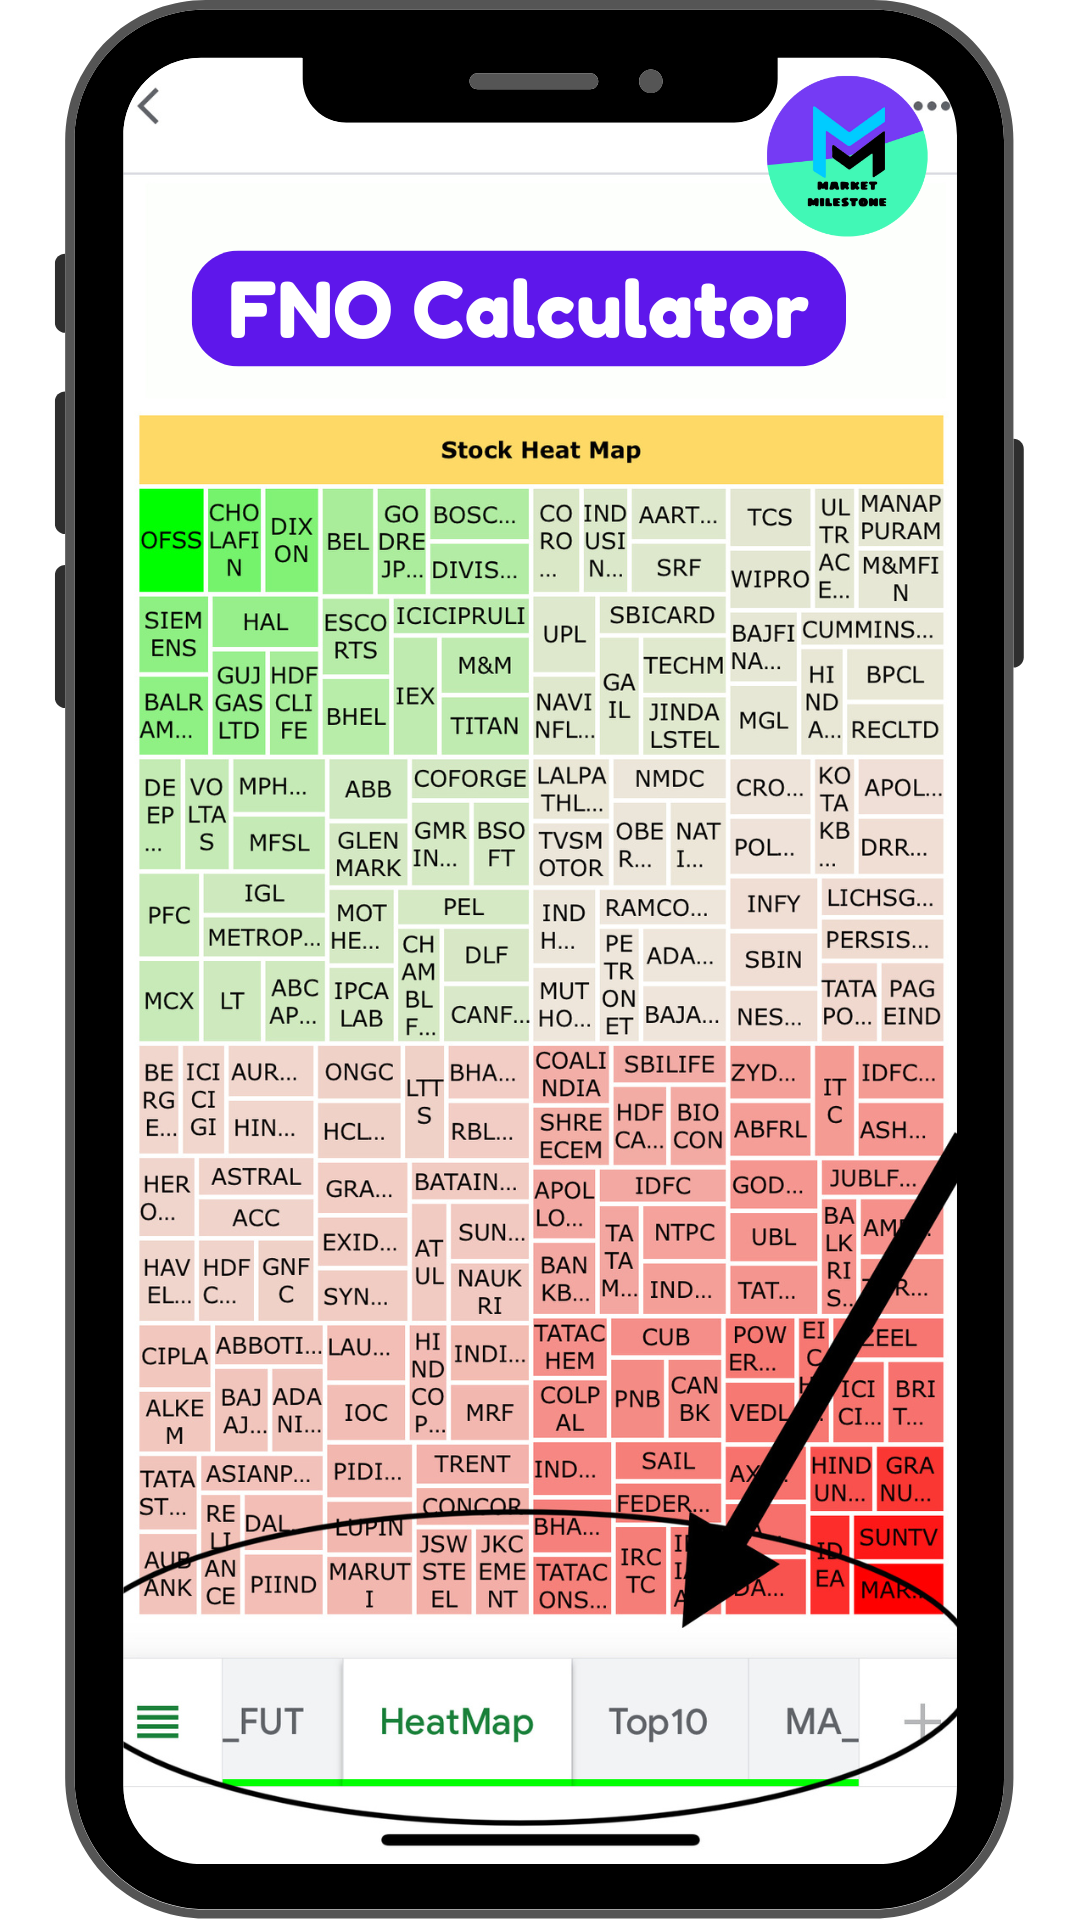
Market dynamics often shift rapidly, and today’s sector analysis reflects this reality. While Nifty IT and Nifty Construction...