


Share Market Crashes: 5 Key Reasons and How to Analyze Top Gainers and Losers

January 22, 2025
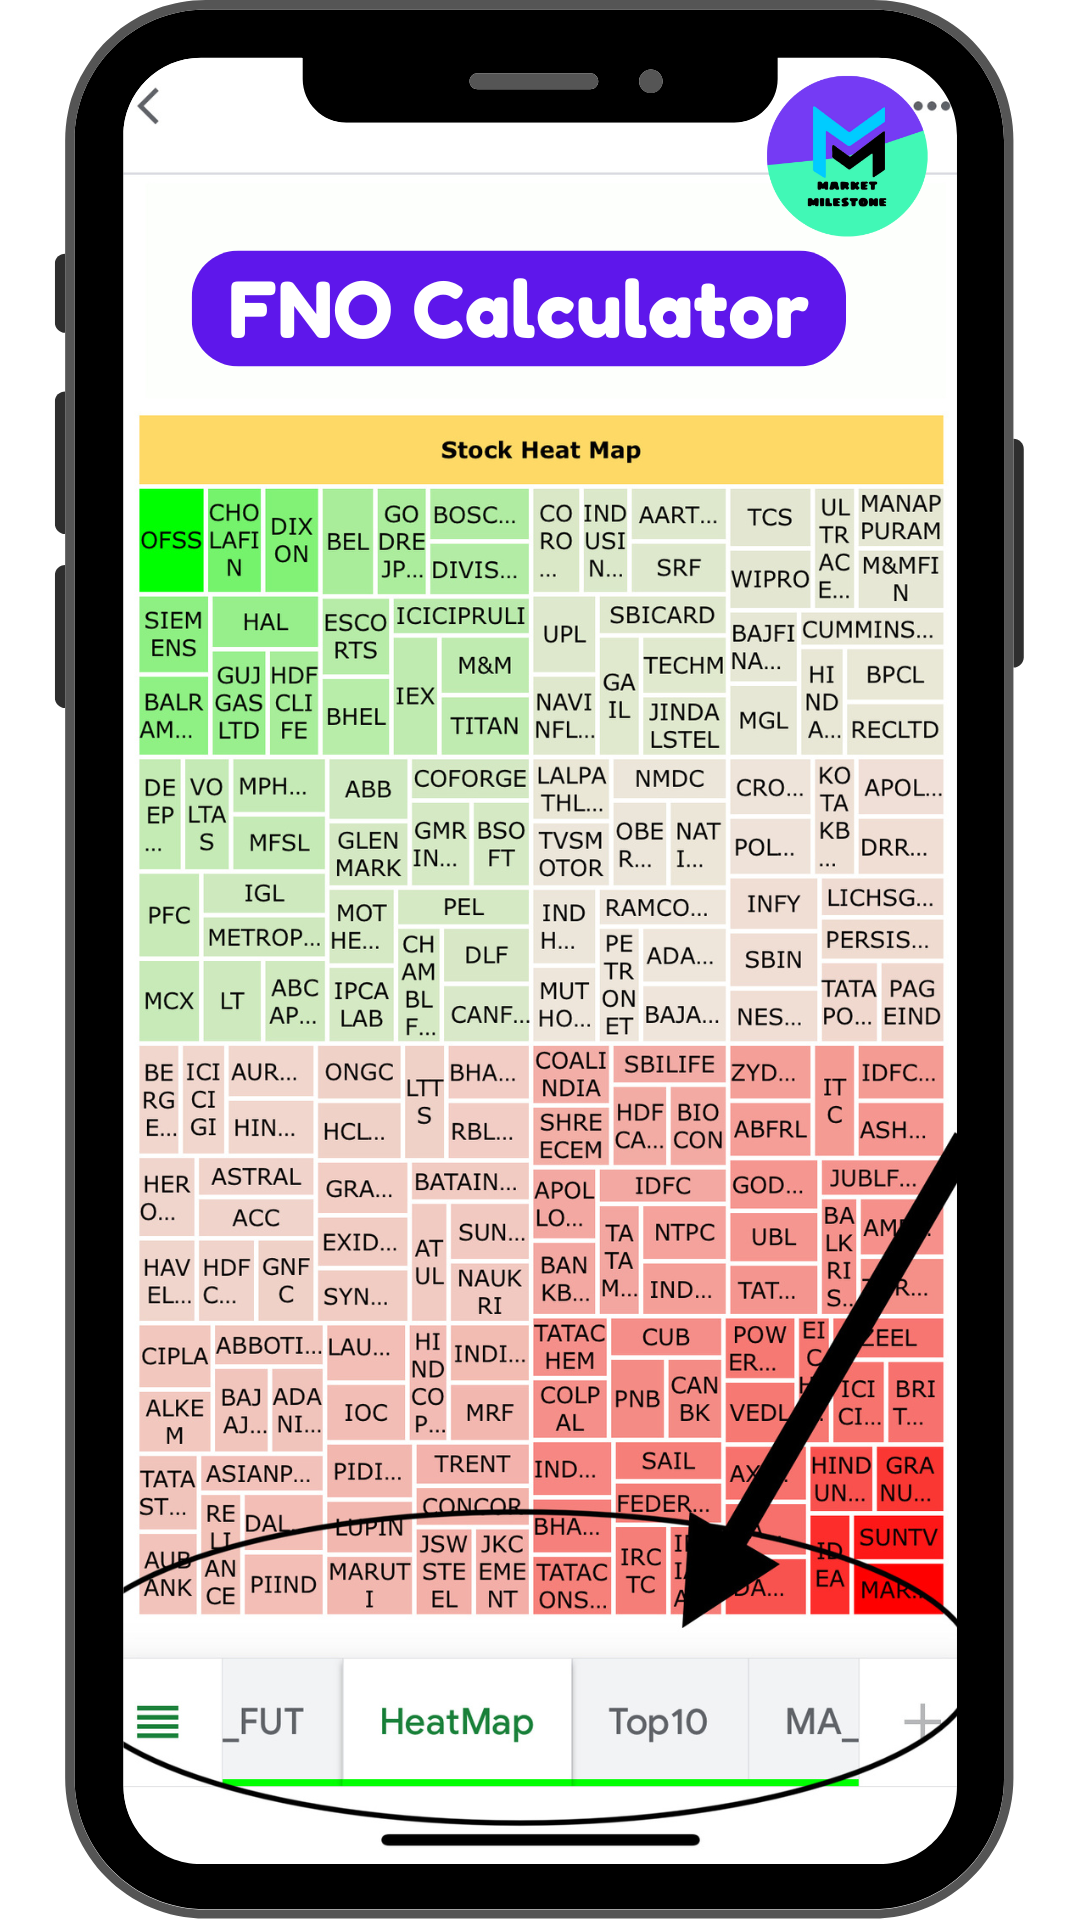
The stock market is inherently volatile, and crashes are an inevitable part of its cycles. Understanding the reasons...